Performance Benchmark Report
The purpose of this document is to provide very broad performance measurements and comparison between Lakesuperior and Fedora/Modeshape implementations.
Environment
Hardware
- MacBook Pro14,2
- 1x Intel(R) Core(TM) i5 @3.1Ghz
- 16Gb RAM
- SSD
- OS X 10.13
- Python 3.7.2
- lmdb 0.9.22
Benchmark script
The script was run by generating 100,000 children under the same parent. PUT and POST requests were tested separately. The POST method produced pairtrees in Fedora to counter its known issue with many resources as direct children of a container.
The script calculates only the timings used for the PUT or POST requests, not counting the time used to generate the random data.
Data Set
Synthetic graph created by the benchmark script. The graph is unique for each request and consists of 200 triples which are partly random data, with a consistent size and variation:
- 50 triples have an object that is a URI of an external resource (50 unique predicates; 5 unique objects).
- 50 triples have an object that is a URI of a repository-managed resource (50 unique predicates; 5 unique objects).
- 100 triples have an object that is a 64-character random Unicode string (50 unique predicates; 100 unique objects).
The benchmark script is also capable of generating random binaries and a mix of binary and RDF resources; a large-scale benchmark, however, was impractical at the moment due to storage constraints.
SPARQL Query
The following query was used against the repository after the 100K resource ingest:
PREFIX ldp: <http://www.w3.org/ns/ldp#>
SELECT (COUNT(?s) AS ?c) WHERE {
  ?s a ldp:Resource .
  ?s a ldp:Container .
}
Raw request:
time curl -iXPOST -H'Accept:application/sparql-results+json' \
-H'Content-Type:application/x-www-form-urlencoded; charset=UTF-8' \
-d 'query=PREFIX+ldp:+<http://www.w3.org/ns/ldp#> SELECT+(COUNT(?s)+AS+?c)'\
'+WHERE+{ ++?s+a+ldp:Resource+. ++?s+a+ldp:Container+. }+' \
http://localhost:5000/query/sparql
Python API Retrieval
In order to illustrate the advantages of the Python API, a sample retrieval of the container resource after the load has been timed. This was done in an IPython console:
In [1]: from lakesuperior import env_setup
In [2]: from lakesuperior.api import resource as rsrc_api
In [3]: %timeit x = rsrc_api.get('/pomegranate').imr.as_rdflib()
Results
| Software | PUT | POST | Store Size | GET | SPARQL Query |
|---|---|---|---|---|---|
| FCREPO 5.0.2 | >500ms [1] | 65ms (100%) [2] | 12Gb (100%) | 3m41s (100%) | N/A |
| Lakesuperior REST | 104ms (100%) | 123ms (189%) | 8.7Gb (72%) | 30s (14%) | 19.3s (100%) |
| Lakesuperior Python | 69ms (60%) | 58ms (89%) | 8.7Gb (72%) | 6.7s (3%) [3] [4] | 9.17s (47%) |
| [1] | POST was stopped at 30K resources after the ingest time reached >1s per resource. This is the manifestation of the “many members” issue which is visible in the graph below. The “Store” value is for the PUT operation which ran regularly with 100K resources. |
| [2] | the POST test with 100K resources was conducted with fedora 4.7.5 because 5.0 would not automatically create a pairtree, thereby resulting in the same performance as the PUT method. |
| [3] | Timing based on a warm cache. The first query timed at 22.2s. |
| [4] | The Python API time for the “GET request” (retrieval) without the conversion to Python in alpha20 is 3.2 seconds, versus the 6.7s that includes conversion to Python/RDFlib objects. This can be improved by using more efficient libraries that allow serialization and deserialization of RDF. |
Charts
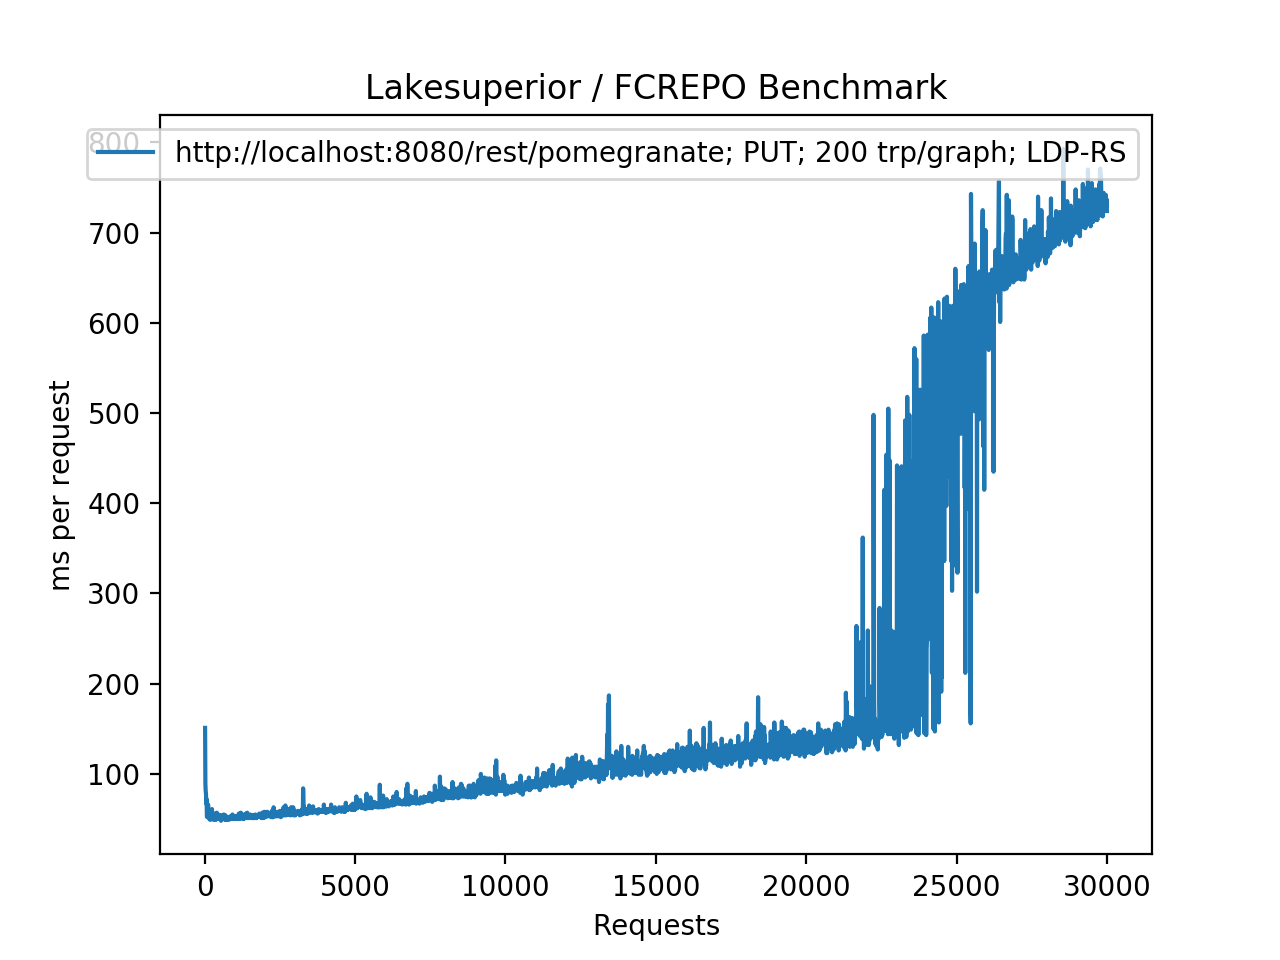
Fedora/Modeshape using PUT requests under the same parent. The “many members” issue is clearly visible after a threshold is reached.
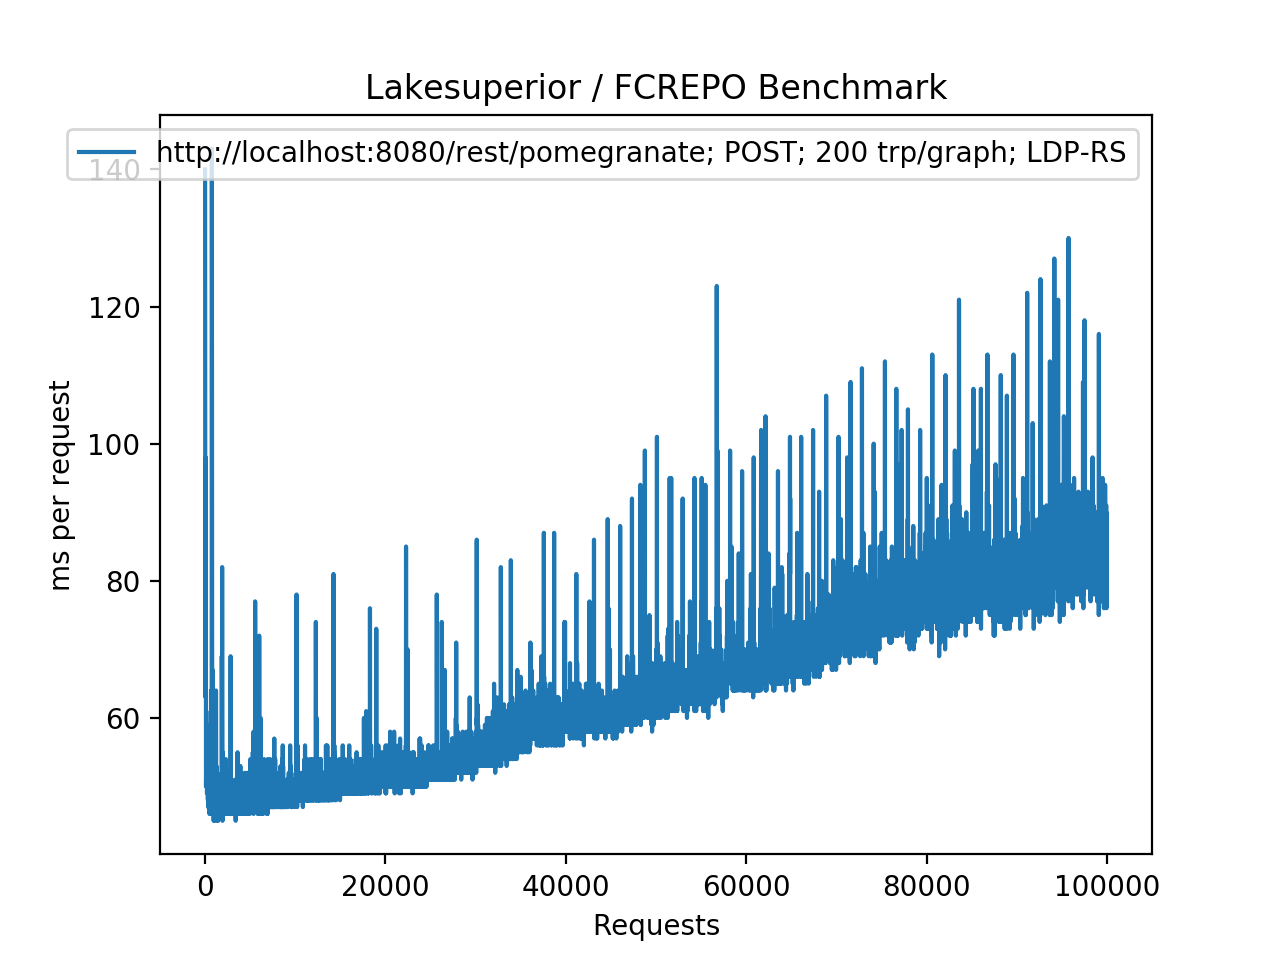
Fedora/Modeshape using POST requests generating pairtrees. The performance is greatly improved, however the ingest time increases linearly with the repository size (O(n) time complexity)
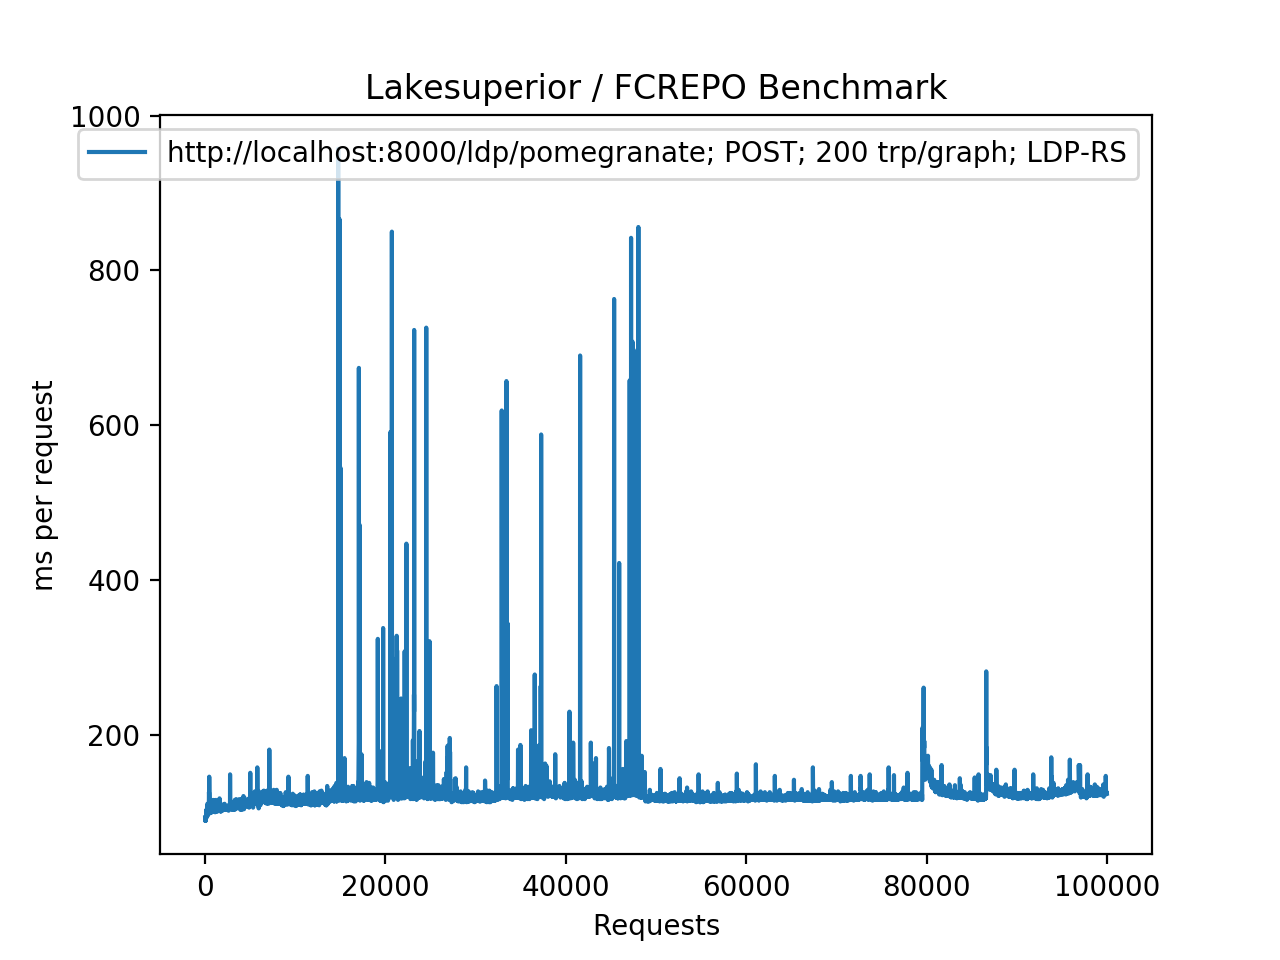
Lakesuperior using POST requests, NOT generating pairtrees (equivalent to a PUT request). The timing increase is closer to a O(log n) pattern.
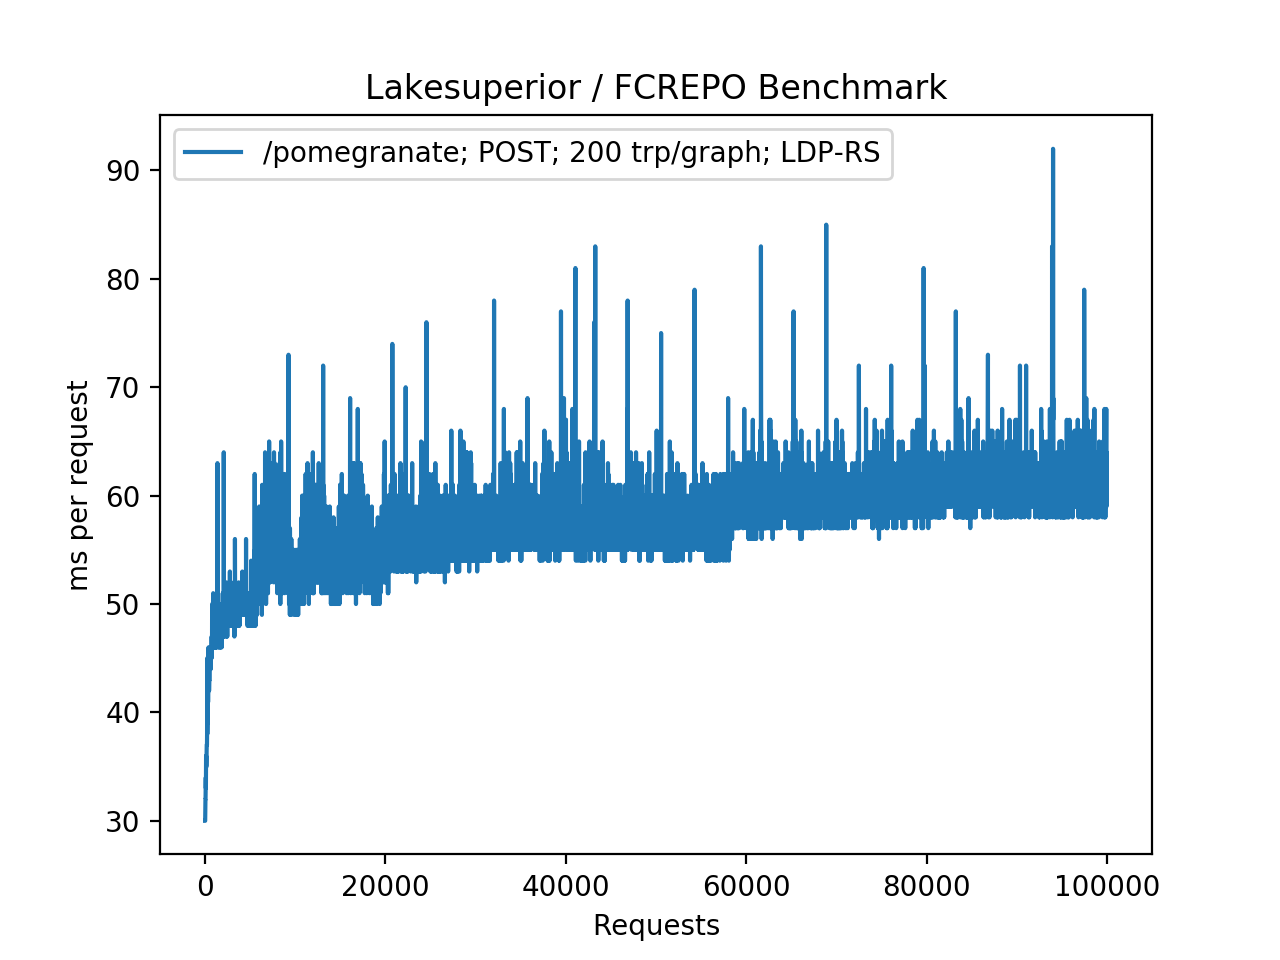
Lakesuperior using Python API. The pattern is much smoother, with less frequent and less pronounced spikes. The O(log n) performance is more clearly visile here: time increases quickly at the beginning, then slows down as the repository size increases.
Conclusions
Lakesuperior appears to be slower on writes and much faster on reads than Fedora 4-5. Both these factors are very likely related to the underlying LMDB store which is optimized for read performance. The write performance gap is more than filled when ingesting via the Python API.
In a real-world application scenario, in which a client may perform multiple reads before and after storing resources, the write performance gap may decrease. A Python application using the Python API for querying and writing would experience a dramatic improvement in read as well as write timings.
As it may be obvious, these are only very partial and specific results. They should not be taken as a thorough performance assessment, but rather as a starting point to which specific use-case variables may be added.